Research Library

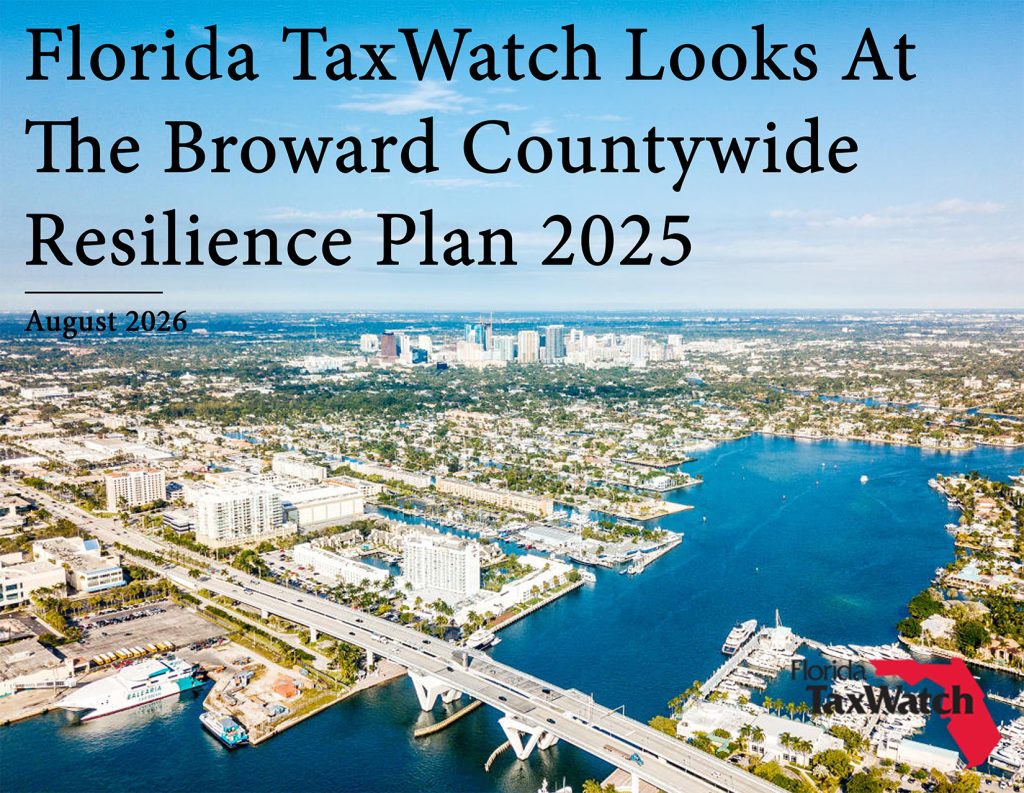
Florida TaxWatch Looks At The Broward Countywide Resilience Plan 2025

Dear Fellow Taxpayer,

With more than 8,400 miles of coastline and a flat, low-lying coastal topography, Florida is especially vulnerable to the effects of sea level rise. Tens of thousands of Florida homes and businesses are at increased risk from the impacts of sea level rise. Accelerated rates of sea level rise will have profound effects on Florida’s coastal ecosystems and will add to Florida’s vulnerability to hurricane storm surge, which poses the greatest threat to lives and property.

Much of Florida’s critical infrastructure — roads, bridges, airports, seaports, railways, water and sewer systems, power plants, etc. — is at low elevations, designed and built without much consideration of future sea level rise. Although originally built far enough from the water’s edge to provide some margin of safety, much of Florida’s critical infrastructure will need to be relocated, elevated, replaced, hardened, or abandoned as sea levels rise, at considerable cost to Florida taxpayers. Southeast Florida is particularly vulnerable to sea level rise due to its low-lying topography, extensive coastline, and porous limestone bedrock.

Recognizing the critical need for a strategic framework to guide the county’s path forward to a more resilient community, Broward County has released its “Countywide Resilience Plan 2025.” Florida TaxWatch undertakes this independent research project to evaluate the Broward “Countywide Resilience Plan 2025.” Our interest, as in all our research, is to make sure the interests of the Broward County taxpayers are well-served.

Respectfully,

Hon. Jeffery D. Kottkamp

President & CEO

Executive Summary

The Plan

Broward County has 31 municipalities, 23 miles of Atlantic Ocean coastline, and more than 300 miles of intracoastal waterways and navigable inland waterways. The county’s low elevation, flat topography, dense urban development, and limited natural drainage make it susceptible to flooding. To mitigate the anticipated risks and impacts of a changing climate and rising sea levels, Broward County has developed the Countywide Resilience Plan 2025 (“the Plan”). The Plan combines engineered solutions (e.g., seawalls, drainage system upgrades, etc.) with natural solutions (e.g., swales, green spaces, etc.) to protect critical infrastructure, manage stormwater, and reduce urban heat.

The “adaptations” included in the Plan were determined through the detailed hydrologic and hydraulic modeling of 47 separate scenarios, each with different rainfall, sea level rise, antecedent, and tidal conditions. These adaptations are geographically tailored to ensure that each zone within the county receives solutions that are best suited to address its risks and potential impacts. The adaptations in the Plan address four approaches: reducing impervious surfaces, adding localized surface storage, and enhancing natural water absorption areas; expanding above-ground storage systems and recovering underground storage to manage excess stormwater; improving existing conveyance structures (e.g., canals, culverts, swales, etc.) while incorporating additional pumping systems to enhance water flow management; and using property-level seawalls, nature-based or engineered structures to prevent flooding and protect infrastructure.

To model and analyze the adaptations, the county was divided into three areas: zone 1 (highly vulnerable areas); zone 2 (eastern areas); and zone 3 (inland areas). This modeling involved analyzing the effects of different combinations of individual adaptations. The final adaptation framework consists of two tiers:

  • Tier 1 (by 2050) --- includes preparations for a two-foot increase in sea level by 2050. Seawalls would be constructed up to five feet North American Vertical Datum (NAVD); drainage systems would be enhanced to manage heavier rainfalls; pumping stations would be added; culvert crossings would be upsized; control structures would be modified; and green infrastructure (e.g., swales, green spaces, etc.) would be implemented to absorb water and reduce urban heat.
  • Tier 2 (by 2070) --- includes preparations for a 3.3-foot increase in sea level by 2050. Seawalls would be constructed up to seven feet NAVD; advanced drainage systems (including pumping and collection systems) would be added to manage increased stormwater volumes behind seawalls; and green spaces would be expanded to mitigate urban heat and enhance biodiversity.

The final adaptations structured around Tiers 1 and 2 include 190+ miles of enhanced seawalls, 159 flood control structures, 33 new pump stations, 41 upgraded crossings, and 1,247 acres-feet of water storage. Tier 1 adaptations include the conversion of selected two-way roads into one-way or single lane roadways, construction of pumping stations and culvert improvements, and the development of new water storage areas. Tier 2 adaptations include all of the Tier 1 adaptations plus increasing the height of seawalls from five feet NAVD to seven feet NAVD.

Capital costs include the costs to construct new swales, road crossings, pumping stations, seawalls and associated drainage, storage areas, and water control structures. The estimated capital cost (in 2024 dollars) of the Tier 1 investments is $20.1 billion. The estimated additional capital cost (in 2024 dollars) of the Tier 2 investments (which include all of the Tier 1 investments plus the cost to increase seawall heights from 5.0 feet NAVD to 7.0 feet NAVD) is $7.9 billion, for a total Tier 2 capital cost of $28.0 billion.

The Plan includes separate cost estimates for investments expected to be financed with public funds and those expected to be financed with private funds. The public sector is expected to fund all the Tier 2 investments except for investments related to seawalls, water storage, and swales on private property. The public portion is estimated at $9 billion and private property improvements will account for the remaining estimated $19 billion. Annual costs include costs associated with administration, operation, maintenance, and the renewal and replacement of project components. Annual costs, estimated at one percent of the capital costs, are estimated at $201 million for Tier 1 investments and $280 million for Tier 2 investments.

The finance plan recognizes that a mix of funding sources will be needed to ensure the Plan is sufficiently funded throughout the 45-year investment period. The Plan identifies several funding sources to finance the implementation of the Plan. The Plan includes a timeline for implementation that is designed to guide the phased implementation of adaptation strategies through 2070. Strategic planning checkpoints have been earmarked in 2032, 2040, 2048, 2056, 2064, and 2070, at which time the county will review latest projections and update the Plan accordingly.

The economic benefits accruing from the Tier 1 and Tier 2 adaptations (avoided property damage, greater flood insurance coverage, increased short term economic activity, increased real estate values, and increased tax revenues) were estimated by analyzing the extent to which the baseline (no actions) impacts of future flooding could be mitigated by each tier. Recurring annual economic benefits were estimated at $1.1 billion for Tier 1 investments and $5.2 billion for Tier 2 investments. Non-recurring economic benefits were estimated at $20 billion for Tier 1 investments and $51 billion for Tier 2 investments. The Plan concludes that the Tier 1 and Tier 2 investments are determined to be economically feasible, as shown by their net present values, return on investment, and benefit-cost ratios.

Florida TaxWatch’s Analysis

The Plan’s strength lies in its data and analysis. The hydrologic and hydraulic flood modeling and urban heat analysis provide a data-driven foundation for Broward County’s resilience planning. The outputs from this modeling form the basis for the adaptations contained in the Plan and serve as the inputs for the economic modeling used to estimate future flood and heat damage.

Basing the Plan on what Broward County would look like in the future if no actions were taken to protect and enhance its resilience provides a benchmark against which potential investments can be measured.  The near-term implementation strategy adopted by the Board of County Commissioners in June 2026 identifies 263 Tier 1 capital improvements (see Table 6) planned to be implemented over the next 15 years. The Plan includes a number of strategic planning checkpoints that will allow the county to periodically assess and refine the policies and capital investments contained in the Plan. These strategic planning checkpoints have been earmarked for 2032, 2040, 2048, 2056, 2064, and 2070. When the county reviews implementation of the Plan at the first (2032) checkpoint, it will be able to review latest projections, track progress toward implementing the Tier 1 capital improvements, and update the Plan accordingly.

Until adopted by formal action of the Board of County Commissioners, the policies and strategies identified in the Plan have no apparent force and effect. To implement the Tier 1 and Tier 2 adaptations, the Plan “recommends for review and consideration” 19 policy strategies. To ensure the equitable treatment of diverse socioeconomic residences in the county, the Plan “recommends” eight continued community economic strategies. The Plan “recommends” that the county quantify and track several key performance indicators to understand the effectiveness of green infrastructure.

Florida TaxWatch believes that the recommended policies and strategies will, if adopted by formal action by the Board of County Commissioners and implemented, go a long way toward effectively mitigating the effects of sea level rise and increased land surface temperature. The Plan combines engineered solutions (e.g., seawalls, drainage system upgrades, etc.) with natural solutions (e.g., swales, green spaces, etc.) to protect critical infrastructure, manage stormwater, and reduce urban heat.

The Plan, as written, appears to be economically feasible. The county deems a project to be economically feasible if the present value of its benefits is greater than the present value of its costs. The project study period for which the Plan evaluated economic feasibility is 2025 to 2125, which includes the construction and operation of Tier 1 and 2 investments over a 101-year period. Using the Vivid Adaptive Regional Input Output (V-ARIO) economic model to model the economy-wide impact of flood events, the Plan concludes that the Tier 1 and Tier 2 investments are determined to be economically feasible, as shown by their net present values, return on investment, and benefit-cost ratios.

The adoption of the near-term implementation strategy by the Board of County Commissioners has largely assuaged concerns about the Plan’s financial feasibility. Although not physically a part of the March 2025 Plan, and in response to Florida TaxWatch’s initial comments on the Plan’s financial feasibility, the Broward Board of County Commissioners on June 9, 2026 approved a “near-term implementation strategy” designed to implement 263 identified Tier 1 stormwater conveyance projects over a 15-year period. Broward County will offer financial incentives in the form of grants to local governments for the construction of the recommended improvements. Broward County will establish a $20 million annual grant program, funds from which will be leveraged (5-to-1return on investment) to generate $100 million annually. Over 15 years, this translates to $1.5 billion in capital improvements funding.

It is unclear how Broward County will coordinate implementation of the Plan with surrounding counties and municipalities. The Plan states that “[F]lood control in South Florida is a shared responsibility between the South Florida Water Management District, counties, municipalities, local drainage districts, and homeowners’ associations.” The specific roles and responsibilities for each of these entities in implementing the Plan are not well-defined, so the answer to the question “who does what?” is unclear.

The implementation strategy adopted by the Broward Board of County Commissioners on June 9, 2026 sheds some light on how the capital improvements identified in the Plan will be coordinated. This strategy includes establishing a $20 million annual grant program through which local government partners may submit proposals for funding for Tier 1 capital improvements projects. Broward County staff will administer the program and manage and track the estimated 263 capital improvements projects identified in Table 6.

In conclusion, the Plan as written is designed to provide the foundation for a basin-level, multi-decade resilient infrastructure and adaptation plan to make Broward County more resilient to the effects of sea level rise and increased surface level temperatures.  Florida TaxWatch understands the difficulty of planning 45 years into the future and commends Broward County for undertaking such an ambitious but necessary planning effort. The formal adoption of the near-term implementation strategy by the Board of County Commissioners in June 2026 helps to make the Plan more “actionable” and should give Broward County taxpayers greater comfort that the Plan will “work.”

Introduction

As global temperatures continue to rise, average sea levels will rise as well. With more than 8,400 miles of coastline and a flat, low-lying coastal topography, Florida is especially vulnerable to the effects of a changing climate. Of the more than 22 million Florida residents in 2020, an estimated 16.1 million (more than 70 percent) lived in a coastal county. Eight of Florida’s ten largest cities, and 42 of Florida’s 50 largest cities, are in relatively high-population density coastal areas.[1] By 2045, the number of Florida residents living in coastal counties is projected to increase to more than 20.1 million.[2]

The scientific community has analyzed the exposure of coastal communities in Florida to chronic inundation[3] under several scenarios. Using the “high sea level rise” scenario, which projects an average of 1.8 feet of sea level rise by the year 2045 and 6.4 feet in 2100, without any additional measures to adapt to rising seas:

  • By 2045, about 64,000 of today’s residential Florida properties, currently home to more than 100,000 people, are at risk of chronic inundation. Miami-Dade, the Florida Keys and the Tampa-St. Petersburg area stand out as being highly exposed within the next 30 years. The total value of at-risk residential properties is about $26 billion. The homes at risk in 2045 currently contribute nearly $350 million in annual property tax revenue.
  • By 2100, more than 1 million residential properties (about ten percent of the state’s current residential properties and home to approximately 2.1 million Floridians) will be at risk of chronic inundation. The current value of these properties is more than $351 billion. The homes at risk by 2100 currently contribute roughly $5 billion collectively in annual property tax revenue.
  • By 2045, about 2,300 of Florida’s current commercial properties, assessed at more than $3 billion, are expected to experience chronic inundation. In 2100, this number jumps to more than 37,500 properties assessed at roughly $46 billion today.
  • More than 40 percent of the homes at risk in the U.S., and approximately 35 percent of the country’s commercial properties at risk in 2100 will be in Florida.[4]

Broward County has 31 municipalities and 23 miles of Atlantic Ocean coastline. Broward County also has more than 300 miles of intracoastal waterways and navigable inland waterways. These waterways not only enhance the scenic beauty of the county, but play an important role in the county’s economy, supporting tourism, the marine industry, and residential waterfront living. The county’s low elevation, flat topography, dense urban development, and limited natural drainage make it susceptible to flooding. Flood control in South Florida is a shared responsibility between the South Florida Water Management District, counties, municipalities, local drainage districts, and homeowners’ associations.

Broward County faces a number of risks associated with a changing climate and rising sea levels, including:

  • Higher intensity rainfall events --- the existing stormwater management and drainage systems lack the capacity to properly drain current and future rainfall events.
  • Urbanization impacts --- there are limited open areas available to store and attenuate rainfall.
  • Increasing temperatures --- temperature increases are magnified by the highly impervious areas.
  • Loss of economic engines --- major industries may move out of the area, negatively impacting the region’s economy.
  • Tourism decline --- tourists may not visit if they feel their vacation may be threatened by flooding.
  • Reduction in personal property value --- home and business owners risk losing their investment due to flooding.
  • Decrease in groundwater storage capacity --- higher groundwater levels mean less storage capacity and a greater accumulation of water at the surface.
  • Rising sea levels --- sea levels continue to rise, increasing the risks of flooding.
  • Surge events --- with more frequent and severe coastal storms, coastal protection measures need to be maintained and bolstered.
  • Reduced number of residents --- unless minimized, the risk of flooding may cause current residents to move and future residents to move somewhere else.
  • Inequitable harm based on socioeconomic status --- homeowners that lack the resources to redesign or rebuild their homes are at a disadvantage.
  • Increase in home insurance premiums --- significant increases in residential insurance premiums will make it difficult for homeowners to afford their homes.
  • Large costs to rebuild or retreat --- significant increase in the costs of rebuilding or relocating away from flood-prone areas.

To mitigate the anticipated risks and impacts of a changing climate and rising sea levels (e.g., widespread flooding, declining property values, rising insurance costs, and disruptions to industries like tourism), Broward County has developed the Countywide Resilience Plan 2025 (“the Plan”). The Plan combines engineered solutions (e.g., seawalls, drainage system upgrades, etc.) with natural solutions (e.g., swales, green spaces, etc.) to protect critical infrastructure, manage stormwater, and reduce urban heat. Florida TaxWatch undertakes this review and analysis of the Plan at the request of the Broward Workshop.

The Plan

Risk Assessment

The assessment of risks, upon which the Plan is based, is based on what Broward County would look like in the future if no actions were taken to protect and enhance its resilience. This provides a benchmark against which potential improvements can be measured. One key assumption going forward is that the South Florida Water Management District would operate the C&SF Flood Control Project so that, prior to each storm, the water levels in the canals would be drawn down one foot under both current and future conditions.

The adaptations included in the Plan were determined through the detailed hydrologic and hydraulic modeling of 47 separate scenarios (see Appendix C of the Plan), each with different rainfall, sea level rise, antecedent, and tidal conditions. All future conditions scenarios incorporated rainfall increases ranging from 11 percent to 23 percent and sea level rise values of two feet for 2040 and 3.3 feet for 2070. Using historical data and predictive models, the Plan assesses how future storms will intensify flooding risks. The analysis also examines changes in groundwater storage, soil saturation, and surface flooding potential. Flood maps for a subset of the scenarios have been compiled into a “scenario viewer” that can be used to compare scenarios and zoom into locations of interest.

The risk assessment also examines the impacts of rising temperatures on the county’s vulnerable communities. The county’s economically vulnerable populations are located largely within or near areas with high land surface temperatures, making them more susceptible to heat-related illnesses and deaths. A vulnerability index is calculated to help identify communities that may need help during disasters or other emergencies. A spatial analysis was conducted in two pilot areas to evaluate the correlation between green areas and land surface temperatures. Based upon this analysis, a distance of 1,000 feet was used as a “radius of influence” that green infrastructure best management practices have on lowering temperatures.

Adaptations

The risk assessment and accompanying analyses were used to develop a series of “adaptations” which are geographically tailored to ensure that each zone within the county receives solutions that are best suited to address its risks and potential impacts. The adaptations in the Plan address four approaches:

  • Green infrastructure --- focuses on reducing impervious surfaces, adding localized surface storage, and enhancing natural water absorption areas.
  • Storage solutions --- includes above-ground storage systems and recovering underground storage to manage excess stormwater.
  • Conveyances --- improves existing structures (e.g., canals, culverts, swales, etc.) while incorporating additional pumping systems to enhance water flow management.
  • Barriers --- uses property-level seawalls, nature-based or engineered structures to prevent flooding and protect infrastructure.

To model and analyze the adaptations, the county was divided into three areas: zone 1 (highly vulnerable areas); zone 2 (eastern areas); and zone 3 (inland areas). This modeling involved analyzing the effects of different combinations of individual adaptations. The final adaptation framework consists of two tiers:

  • Tier 1 (by 2050) --- includes preparations for a two-foot increase in sea level by 2050. Seawalls would be constructed up to five feet North American Vertical Datum (NAVD)[5]; drainage systems would be enhanced to manage heavier rainfalls; pumping stations would be added; culvert crossings would be upsized; control structures would be modified; and green infrastructure[6] (e.g., swales, green spaces, etc.) would be implemented to absorb water and reduce urban heat.
  • Tier 2 (by 2070) --- includes preparations for a 3.3-foot increase in sea level by 2050. Seawalls would be constructed up to seven feet NAVD; advanced drainage systems (including pumping and collection systems) would be added to manage increased stormwater volumes behind seawalls; and green spaces would be expanded to mitigate urban heat and enhance biodiversity.

Policies and Strategies

The Plan “recommends for review and consideration” the following 19 policy strategies:

  • Develop a green streets program --- the conversion of selected two-lane roadways to one-lane roadways will widen the drainage areas along the right-of-way, increasing available green space. Implementation requires conducting a pilot and establishing an incentive program. Funding would come from the county transportation surtax, county and municipal stormwater funding, and grants.
  • Increase pervious percentages --- implement a program to incentivize property owners to convert impervious surfaces (e.g., concrete or asphalt) to pervious surfaces (e.g., gravel or permeable pavers). Implementation requires establishing an incentive program. Funding would come from the county and municipal stormwater funding, and grants. In addition, Broward County could explore a stormwater credit trading system.
  • Increase stormwater storage management requirements --- enhance on-site storage capacity requirements to promote better stormwater management and resilience. Implementation would require owners of property that is being developed or redeveloped to provide on-site water retention or detention for a specified amount above existing requirements. This policy would be privately funded.
  • Reduce parking minimums --- revised parking space requirements for new developments and redevelopments will promote more efficient land use and increase the storage capacity and pervious areas. Implementation requires a parking sufficiency study to justify a reduction in the number of parking spaces needed to support development/redevelopment. The study would be funded from the county’s general fund.
  • Promote efficient land use --- offer incentives to encourage property owners to replace asphalt parking with alternative solutions that maximize space and reduce impervious surfaces. and establish an annual county fee per 1,000 square feet of asphalt parking. Implementation would require the county and its municipalities to work together to develop this policy in concert with the South Florida Water Management District and local drainage/water control districts. Funding would come from the new fee and, if needed, from the county general fund.
  • Promote resilient land use on private properties --- provide development incentives and variances in exchange for additional storage and/or significant green infrastructure if a “net benefit” to the community would be achieved. Implementation would require the county and its municipalities to define the term “net benefit” and establish allowable variances to permit water withdrawal. This policy would be privately funded.
  • Enhance and adapt the county’s seawall ordinance --- revisit minimum elevation requirements for tidal flood barriers. Implementation would require an updated seawall ordinance to be implemented by 2050 with requirements to upgrade seawalls from 5.0 feet NAVD to 7.0 feet NAVD. No additional funding is required, except for staff and consultant time to study and draft the ordinance.
  • Incorporate resilience into complete streets design standards --- revise street design standards to include resilience standards. Implementation would require the county to “encourage” the incorporation of resilient design elements into local street design standards. Funding would come from county and municipal stormwater funding and grants.
  • Prioritize resilient growth priority areas --- identify and prioritize areas for development and redevelopment that align with the County’s resilience objectives. Implementation would require conducting a study to identify and prioritize areas for development and redevelopment that align with the county’s resiliency objectives. Funding would come from the county’s general fund.
  • Streamline post-disaster redevelopment planning and processes --- streamline recovery programs that assist residents in rebuilding or relocating. Implementation would require the county to identify processes for streamlining federal recovery programs (rebuilding and voluntary buyout of properties that experience repetitive storm damage), and to make it easier for residents to access these resources. Funding would come from grants.
  • Promote resilient home construction and retrofits --- provide the tools, incentives, and resources for homeowners to make resilience improvements to their properties. Implementation would require the provision of monetary assistance and/or educational materials or resources to homeowners. Funding would come from a local loan program.
  • Mitigate rising insurance costs --- explore mechanisms to reduce the burden of rising windstorm and flood insurance costs. Implementation would require the county to work with other local, state, federal, and private entities to make sure the benefits of the Plan’s risk reduction measures are fully realized through reduced insurance premiums. No additional funding is anticipated.
  • Implement resilient improvements at public facilities --- implement resilient improvements to county facilities and encourage municipalities and other public entities to do the same. Implementation would require the incorporation of stormwater retention/storage improvements, storm fortification, and shading/cooling features at county facilities. Funding would come from grants.
  • Utilize technology to enhance flood protection --- establish a framework for remote monitoring and control of newly adapted structures, enabling timely adjustments to pre-storm water levels.[7] Implementation would require establishing a remote monitoring and control system to ensure proactive water management and real-time adjustments to water levels. Funding would come from public-private partnerships and grants.
  • Establish overlay districts to enhance resilience --- provide incentives for redevelopment in areas where additional storage will improve flooding and reduce urban heat. Implementation would require establishment of overlay zones that require additional regulations on top of the underlying zoning requirements. In addition to the financial incentives, the county may be able to explore development bonuses that would not require general funds.
  • Develop a cleaning, maintenance, rehabilitation, and testing program --- require routine cleaning and maintenance of stormwater infrastructure. Implementation would require establishing a clearing and maintenance program to ensure functionality over the long term. Funding would come from county and municipal stormwater funding and grants.
  • Improve resilient development requirements --- develop a resilient land development code that complies with the Plan. Implementation would require the county, working with the municipalities, to identify specific updates to development standards and requirements and incorporate them into the land development code. No additional funding is anticipated.
  • Document future (2070) seawall requirements --- provide information to the public to prepare for future modifications to the seawall ordinance. Implementation would require alerting the public now to prepare them for future modifications to the county’s seawall ordinance. This policy would be privately funded.
  • Designate priority zone 1 as an adaptation action area --- adopt guidance and standards to ensure that land use proposals and major redevelopments deliver optimized heat and flood mitigation benefits. Implementation would require amending the county’s land use plan to establish priority zone 1 as an adaptation action area. No additional funding is anticipated.

Socioeconomic Strategies

To ensure the equitable treatment of diverse socioeconomic residences in the county, the Plan “recommends” the following continued strategies:

  • Involve residents from all socioeconomic backgrounds in the planning process through public meetings, workshops, and surveys.
  • Provide accessible information about climate risks and resilience strategies, using multiple languages and culturally relevant materials to reach diverse communities.
  • Allocate resources to upgrade infrastructure in underserved areas, such as improving drainage systems, building food barriers, and enhancing public transportation.
  • Implement green infrastructure projects in low-income neighborhoods to reduce flood risks and improve environmental quality.
  • Promote the construction and retrofitting of affordable, resilient housing that can withstand extreme weather events.
  • Provide financial and logistical support for residents who need to relocate (voluntary) from high-risk areas.
  • Establish cooling centers and distribute resources like fans and air-conditioning units to vulnerable populations during extreme heat events.
  • Develop and disseminate emergency response plans tailored to the needs of diverse communities.
  • Ensure that shelters and emergency services are accessible to all residents.
  • Offer training programs in green jobs and resilience-related fields to create economic opportunities for low-income residents.
  • Provide grants and low-interest loans to small businesses in vulnerable areas to help them implement resilience measures and recover from climate impacts.
  • Advocate for local and state policies that prioritize equity in climate adaptation and resilience zoning laws, building codes, and funding allocations.
  • Ensure that diverse communities are represented in decision-making bodies and advisory committees related to climate resilience.

Swale and Stormwater System Maintenance

The proper maintenance of swales and stormwater management systems is critical in ensuring the long-term effectiveness of the county’s flood mitigation and stormwater management efforts. Regular maintenance of swales helps to prevent blockage and ensure optimal infiltration rates. Proper maintenance of stormwater management systems helps to control risks and maintain water quality. Each municipality within Broward County is responsible for swale and stormwater management system maintenance activities.

Green Infrastructure

Historically, green infrastructure has focused on the treatment and retention of approximately 1.25 inches of runoff from impervious surfaces. This runoff makes up less than 15 percent of the current ten-year, 72-hour design storm. A 20 percent projected increase in the ten-year, 72-hour design storm equates to a storm depth increase of approximately two inches, a depth that can practically be captured and retained using conventional green infrastructure. Retrofitting green infrastructure to manage a two-inch storm depth can help to alleviate demands on existing drainage infrastructure with limited capacity.[8]

The Plan recommends that the county quantify and track several key performance indicators to understand the effectiveness of green infrastructure. Specific performance indicators that the county will track include:

  • Volume of runoff absorbed by green infrastructure over a period of time;
  • Volume of runoff conveyed to an area with more available storage;
  • Volume of runoff captured and stored for later use in rainwater harvesting systems;
  • Volume of storage made available per acreage of floodplain restoration;
  • Volume of water absorbed per acreage of created or restored wetlands;
  • Percentage of urban tree canopy in a particular area;
  • Reduction of energy use in a building after green roof and/or wall installation;
  • Percentage of green infrastructure projects that create potential habitats for animals;
  • Percentage of native plants used in green infrastructure projects;
  • Track public participation in volunteer programs, workshops, and educational campaigns that involve green infrastructure efforts;
  • Collect qualitative data, such as feedback from training of local government staff, developers, and residents;
  • Capital and maintenance costs of green infrastructure projects;
  • Create models that simulate potential storm and flood scenarios to ensure the community is equally protected; and
  • Assess community benefits, such as increased green space, improved aesthetic value, and enhanced biodiversity.

Capital and Annual Costs of Tier 1 and Tier 2 Investments

Capital costs include the costs to construct new swales, road crossings, pumping stations, seawalls and associated drainage, storage areas, and water control structures. The estimated capital cost (in 2024 dollars) of the Tier 1 investments is $20.1 billion. The estimated additional capital cost (in 2024 dollars) of the Tier 2 investments (which include all of the Tier 1 investments plus the cost to increase seawall heights from 5.0 feet NAVD to 7.0 feet NAVD) is $7.9 billion, for a total Tier 1 and Tier 2 capital cost of $28.0 billion.

The Plan includes separate cost estimates for investments expected to be financed with public funds and those expected to be financed with private funds. The public sector is expected to fund all the Tier 1 and Tier 2 investments except for investments related to seawalls, water storage, and swales on private property. All told, adaptations identified in the Plan include more than 190 miles of enhanced seawalls; 159 control structures; 33 new pumping stations; 41 upgraded crossings; and 1,247 acre-feet of storage. The public portion is estimated at $9 billion and private property improvements will account for the remaining estimated $19 billion. The estimates of public and private capital costs of Tiers 1 and 2 are summarized in Tables 1 and 2, respectively.

Annual costs include costs associated with administration, operation, maintenance, and the renewal and replacement of project components. Annual costs for Tier 1 and Tier 2 investments are estimated at one percent of the estimated capital costs.[9] As shown in Table 3, the annual costs of Tier 1 investments are estimated at $201 million, and the annual costs of Tier 2 investments are estimated at $280 million.

Finance Plan

The finance plan recognizes that a mix of funding sources will be needed to ensure the Plan is sufficiently funded throughout the 45-year investment period. The Plan anticipates that “the county will work with the municipalities, the neighboring counties, and the state and federal governments as well as the private sector to identify sustainable and sufficient funding sources that would comprise the finance plan.” The Plan identifies several funding sources to finance the implementation of the Plan.

Federal Funding

  • Federal Emergency Management Agency (FEMA) grants --- are available for eligible mitigation activities that reduce disaster losses and protect life and property.
  • Pre-disaster mitigation grants --- are funded at the request of a member of Congress to approve a specific amount of discretionary funding to a State or local government entity, or 501(c) (3) to plan for and implement sustainable cost-effective measures designed to reduce the risk to individuals and property from future natural hazards.
  • National coastal resilience fund --- funds are used to restore, increase, and strengthen natural infrastructure to protect communities and enhance habitats for fish and wildlife.
  • Water Infrastructure Financing and Innovation Act (WIFIA) --- eligible projects include those that address sustained or intermittent increases in water flow, such as projects that address food risks due to stormwater, and septic to sewer efforts where septic systems are undermined by rising groundwater.
  • Clean Water Act (CWA) Section 319(h) funding --- used to implement programs and projects designed to reduce nonpoint source pollution as identified in the State’s Non-Point Source Management Plan (NPSMP).
  • Coastal Program --- provides funding for habitat improvement projects that increase coastal resiliency by improving the ability of coastal ecosystems to adapt to environmental changes and by supporting natural and nature-based infrastructure projects to protect and enhance coastal habitats.
  • Disaster supplemental funding --- can be awarded to assist a wide variety of activities related to disaster recovery, including strategic planning grants, and public works construction assistance.
  • Public works and economic adjustment assistance programs --- funds projects such as long-term disaster recovery and resiliency plans and upgrades that make infrastructure more resilient, that address diverse economic development needs, and prioritize local and regional stakeholders.

State Funding

  • Resilient Florida Grant Program (RFGP) --- offers planning grants to develop a vulnerability assessment that addresses sea level rise concerns for critical infrastructure assets, and implementation grants to assist communities with the construction and upgrade of the projects identified in approved vulnerability assessments.
  • Clean Water State Revolving Fund Loan Program (CWSRF) --- provides low-interest loans to entities for the implementation of stormwater-related projects.
  • State Water-quality Assistance Grant (SWAG) --- offers grants for projects that implement green stormwater infrastructure projects.

Community-Based Funding

  • County sales surtax --- if approved by the state and Broward voters, a surtax could be applied to the sale of taxable goods in the county, the proceeds from which would be used to finance some or all of the county’s resilient investments.
  • County ad valorem tax --- increased millage rates of taxable property could generate the money needed to finance some or all of the county’s resilient investments.
  • Stormwater utility fees --- are charged to property owners to fund the construction, maintenance, and operation of stormwater infrastructure, including treatment and flood prevention projects.
  • Revenue bonds --- a type of municipal bond secured with the revenue generated from a specific project or service.
  • General obligation bonds --- a type of municipal bond backed entirely by the issuer’s creditworthiness and ability to levy taxes.
  • Resilience bond --- a type of green bond that would be pledged to finance specific climate resilient projects.

Regional Collaboration

Regional efforts should focus on cost-efficient design of resiliency investments and equitable sharing of their costs. Public-private partnerships are based on creating a win-win situation between the public and the private entity and the specific projects and agreements should be identified on a case-by-case basis as opportunities arise. Other areas of collaboration include the county working with insurance companies to develop premium reduction programs to property owners who implement resilience measures.

Implementation

By dividing the county into three geographic zones (highly vulnerable areas, eastern areas, and inland areas) and two project tiers (Tier 1 and Tier 2), the 45-year plan affords the county considerable flexibility and scalability as it addresses the risks posed by a changing climate and associated sea level rise. The Plan includes a number of strategic planning checkpoints that will allow the county to periodically assess and refine the policies and capital investments contained in the Plan, as it addresses immediate risks while preparing for more frequent and severe conditions going forward.

Urgent resilience needs are addressed through implementation of Tier 1 investments. These include making sure seawalls in the highly vulnerable areas and eastern areas are up to 5.0 feet NAVD; converting selected two-lane roads to one lane, installing additional pumping stations and upgrading road crossings, and enlarging culverts; creating dedicated storage areas and expanding pervious surfaces; and adjusting control drainage system elevations to maintain head pressure against sea level rise. Longer term issues will be addressed with the implementation of Tier 2 investments. Tier 2 builds on Tier 1 by making sure seawall elevations in the highly vulnerable and eastern areas are raised up to 7.0 feet NAVD.

Timeline

The Plan includes a timeline for implementation that is designed to guide the phased implementation of adaptation strategies through 2070. Strategic planning checkpoints (referenced above) have been earmarked in 2032, 2040, 2048, 2056, 2064, and 2070, at which time the county will review latest projections and update the Plan accordingly.

Prioritization

Start dates for projects are phased geographically, beginning with the most vulnerable areas (zone 1), the coastal areas (zone 2), and the western parts of the county (zone 3). Projects are assigned priorities, ranking from one to four, which helps form logical groupings within each phase. The Plan acknowledges that other projects are being planned by each municipality “under separate master planning efforts.” Although not specifically part of the Plan, the Plan suggests that these projects could be prioritized and budgeted “in parallel” with the Plan.

Post-Implementation Development

Areas that would remain at risk of flooding after implementation of the resilience strategies were identified through the use of hydrological modeling. This approach is designed to ensure that the base flood elevation assigned to structures within specific sub-basins is accurately tailored to the flood risks within each area. Sub-basins were “flagged” if they contained clusters of structures with flood depths exceeding six inches and where more than 30 percent of the properties were affected.

Within these flagged sub-basins, additional strategies are proposed to reduce future flooding, including:

  • Elevating structures to meet base flood elevation standards --- placing occupied spaces and critical building components above anticipated flood levels significantly reduces flood risk.
  • Dry floodproofing for adaptation of existing structures --- making a structure watertight serves as a practical alternative to elevation.
  • Voluntary property acquisition and conversion for stormwater management --- appropriate for properties with recurring and severe flooding, where structural retrofits are neither feasible nor cost-effective.
  • Raising roads --- elevating roads helps to ensure that vital transportation networks remain functional.

Economic Benefits

The outputs from the modeling serve as the inputs for the economic model[10] used to estimate the impacts of sea level rise on the region’s economy. The dollar values of the economic benefits accruing from the Tier 1 and Tier 2 adaptations were estimated by analyzing the extent to which the baseline (no actions) impacts of future flooding could be mitigated by each tier.

NOTE: The Plan assumes that there are no changes in Broward County’s economy --- including no changes in land use, gross domestic product (GDP), employment, or population.

Avoided Property Damage

Under current flooding conditions, the average annual property damage countywide is estimated at $820 million. As the sea level rises to two feet, average annual property damage is expected to increase to $2.5 billion (if no other actions are taken). Implementation of the Tier 1 investments is expected to reduce average annual property damage to $1.7 billion, a reduction of about $800 million. Implementation of the Tier 2 investments is expected to reduce average annual property damage to $560 million, a reduction of about $1.9 billion.

As the sea level rises to 3.3 feet, average annual property damage is expected to increase to $4.9 billion (if no other actions are taken). Implementation of the Tier 1 investments is expected to reduce average annual property damage from $4.9 billion to $4.7 billion, a reduction of about $200 million. Implementation of the Tier 2 investments is expected to reduce average annual property damage from $4.9 billion to $1.3 billion, a reduction of about $3.6 billion.

Increased Short-Term Economic Activity

Gross Value Added (GVA) is a measure of the business sector’s contribution to overall economic activity, including income produced within the county by all sources. Economic benefits modeled are based upon increased GVA from lower direct flooding impacts to businesses and reduced disruption to roads. Current flooding conditions are expected to reduce the average annual GVA countywide by $300 million, and the number of jobs by 5,700.

As the sea level rises to two feet, the average annual GVA loss is expected to increase from $300 million to $400 million (if no other actions are taken). Implementation of the Tier 1 investments is expected to reverse this trend, keeping the average annual GVA loss at about its current level ($290 million). Employment losses are expected to be lower under Tier 1, from 5,700 jobs lost (current) to 4,300.

As the sea level rises to 3.3 feet, and no action is taken, the average annual GVA loss is estimated to be $900 million, with an estimated 12,000 fewer jobs. Implementation of the Tier 2 investments is expected to reduce these losses to $240 million in lost GVA and there would be 3,800 fewer jobs. The retail trade and real estate services sectors of the economy will suffer the greatest impacts, and the construction sector will experience the least impacts.

Greater Flood Insurance Coverage

Implementation of the Tier 1 and Tier 2 investments would increase the number of residential housing units with National Flood Insurance Program (NFIP) policies. If no flood mitigation strategies are implemented, a two-foot rise in sea level is expected to reduce the number of NFIP policies from 175,000 currently to 49,000. A 3.3-foot rise in sea level is expected to reduce the number of NFIP policies from 175,000 currently to 41,000.

The Tier 1 investments are expected to increase the number of NFIP policies from 49,000 to 94,000 once the sea level rises to two feet. The Tier 2 investments are expected to increase the number of NFIP policies from 41,000 to 122,000 once the sea level rises to 3.3 feet. Most property owners experiencing greater flood damage due to sea level rise would initially expect increases in the cost of flood insurance. With more and more recurring storm damages, many owners of the storm-damaged properties would drop out of the market because their premiums become unaffordable.

Currently, the total countywide flood insurance coverage is $44 billion. Under two feet of sea level rise, with no actions taken, total coverage is expected to fall to $13 billion. Implementation of the Tier 1 investments is expected to increase coverage by $12 billion, which is still $19 billion below current coverage levels. Under 3.3 feet of sea level rise, flood insurance coverage is expected to fall to $11 billion. Implementation of the Tier 2 investments is expected to increase coverage to countywide by $20 billion, increasing coverage to $31 billion, which is $13 million below current coverage levels.

Increased Real Estate Values

The estimated increase in property values under Tiers 1 and 2 reflect how much more a property would be worth if the tiers were implemented. Under two feet of sea level rise and with no actions taken, Broward County residential property value would be $24 billion lower than current values. Implementation of the Tier 1 investments is expected to preserve $8 billion of property value and associated tax revenue; however, countywide residential property values would still be $16 billion less than the baseline. Under 3.3 feet of sea level rise and with no actions taken, residential property levels would be $39 billion lower than current values. Implementation of the Tier 2 investments is expected to preserve $31 billion of property value; however, countywide residential property values would still be $8 billion less than the baseline.

Increased Tax Revenue

Sea level rise has the potential to affect two categories of taxes collected by Broward County:

  • Production-related taxes --- includes sales and excise taxes, customs duties, business property taxes, motor vehicle licenses, severance taxes, other taxes, and special assessments; and
  • Ad valorem tax --- based on the market value of real estate.

The revenue from both of these tax revenue sources is expected to fall over time as sea levels rise. Implementation of the Tier 1 investments is expected to increase annual average tax revenue by $210 million, which recovers about five percent of the tax revenue losses projected for a two-foot sea level rise. Implementation of the Tier 2 investments is expected to increase annual average tax revenue by $960 million, which recovers about 22 percent of the tax revenue losses projected for a 3.3-foot sea level rise. The estimated economic benefits of the two-tiered Plan are summarized in Table 4.

Economic Benefit Values Not Estimated

The Plan acknowledges that there are other benefits of the Tier 1 and Tier 2 adaptations that were not estimated. These include reduced disruption to public services, increased investment, avoided demographic disruptions, increased tourism, and human capital benefits.

Economic Feasibility

A capital project is deemed to be economically feasible if the present value of its benefits is greater than the present value of its costs. The project study period for which the Plan evaluated economic feasibility is 2025 to 2125, which includes the construction and operation of Tier 1 and 2 investments over a 101-year period.

Construction of the Tier 1investments is scheduled to begin in 2025 and be completed 15 years later (2040). The Tier 1 benefits of flood damage avoided and short-term GVA loss are expected to begin in 2026. Real estate benefits are expected to begin in 2031, six years after construction begins. Construction of the additional Tier 2 investments is expected to begin in 2040 and be completed 30 years later (2070). The additional Tier 2 benefits of flood damage avoided and short-term GVA loss are expected to begin in 2041. The annual benefits of the Tier 2 investments minus the Tier 1 investments are fully realized each year after 2070. The real estate benefits under the additional Tier 2 investments are expected to begin in 2045, six years after construction begins. Once a tier’s construction is 100 percent complete, the full annual cost of the tier is applied.

The investment projects in Tiers 1 and 2 are expected to remain fully operational through 2125. As such, the Tier 1 and Tier 2 investments will have been fully operational for 84 and 54 years, respectively. The annual benefits and costs are discounted at a rate of five percent per year,[11] representing an opportunity cost of Broward County. The benefit values have been adjusted to reflect 2024 values and increased each year by 2.53 percent (average annual inflation). As shown in Table 5, both Tier 1 and Tier 2 investments are determined to be economically feasible, as shown by their net present values, return on investment, and benefit-cost ratios.

Florida TaxWatch’s Analysis

In its analysis of the Plan, Florida TaxWatch will focus primarily on answering the following questions:

  • Is the Plan based on relevant and appropriate data and analysis?
  • Does the Plan identify specific and measurable benchmarks that, if achieved, mark progress toward making Broward County more resilient to the effects of sea level rise?
  • Are the policies and strategies identified in the Plan likely to make Broward County more resilient to the effects of sea level rise?
  • Is the Plan financially feasible?
  • Are roles and responsibilities for implementing the Plan clearly defined?
  • What is the legal force and effect of the Plan?

Data and Analysis

The Plan’s strength lies in its data and analysis. Florida TaxWatch agrees that “[T]he hydrologic and hydraulic (H&H) flood modeling and urban heat analysis… provide a data-driven foundation for Broward County’s resilience planning.” The outputs from this modeling form the basis for the adaptations contained in the Plan and serve as the inputs for the economic modeling used to estimate future flood and heat damage.

The “adaptations” included in the Plan were determined through the detailed hydrologic and hydraulic modeling of 47 separate scenarios, each with different rainfall, sea level rise, antecedent, and tidal conditions. These adaptations are geographically tailored to ensure that each zone within the county receives solutions that are best suited to address its risks and potential impacts. The outputs from the modeling serve as the inputs for the economic model used to estimate the impacts of sea level rise on the region’s economy.

All future conditions scenarios incorporated rainfall increases ranging from 11 percent to 23 percent and sea level rise values of two feet for 2040 and 3.3 feet for 2070. Using historical data and predictive models, the Plan assesses how future storms will intensify flooding risks. The analysis also examines changes in groundwater storage, soil saturation and surface flooding potential.

The risk assessment also examines the impacts of rising temperatures across the county. Economic data were evaluated by Census block to help identify communities that may need help during disasters or other emergencies. A spatial analysis was conducted in two pilot areas to evaluate the correlation between green areas and land surface temperatures.

Specific and Measurable Benchmarks

Basing the Plan on what Broward County would look like in the future if no actions were taken to protect and enhance its resilience provides an overall benchmark against which potential improvements can be measured. The Plan identifies an approximate implementation date of 2027 and includes a timeline for implementation that is designed to guide the phased implementation of adaptation strategies through 2070.

The final adaptations structured around Tiers 1 and 2 include 190+ miles of enhanced seawalls, 159 flood control structures, 33 new pump stations, 41 upgraded crossings, and 1,247 acres-feet of water storage. Tier 1 adaptations include the conversion of selected two-way roads into one-way or single-lane roadways, construction of pumping stations and culvert improvements, and the development of new water storage areas. Tier 2 adaptations include all of the Tier 1 adaptations plus increasing the height of seawalls from five feet NAVD to seven feet NAVD. Start dates for projects are phased geographically, beginning with the most vulnerable areas (zone 1), the coastal areas (zone 2), and the western parts of the county (zone 3). Projects are assigned priorities, ranking from one to four, which helps form logical groupings within each phase.

The near-term implementation strategy adopted by the Board of County Commissioners in June 2026 identifies 263 Tier 1 capital improvements (see Table 6) planned to be implemented over the next 15 years. The Plan includes a number of strategic planning checkpoints that will allow the county to periodically assess and refine the policies and capital investments contained in the Plan. These strategic planning checkpoints have been earmarked for 2032, 2040, 2048, 2056, 2064, and 2070. When the county reviews implementation of the Plan at the first (2032) checkpoint, it will be able to review latest projections, track progress toward implementing the Tier 1 capital improvements, and update the Plan accordingly.

Policies and Strategies

Until adopted by formal action of the Board of County Commissioners, the policies and strategies identified in the Plan have no apparent force and effect. To implement the Tier 1 and Tier 2 adaptations, the Plan “recommends for review and consideration” 19 policy strategies. To ensure sensitivity to the unique needs of the county’s diverse population, the Plan “recommends” eight continued community economic strategies. The Plan “recommends” that the county quantify and track several key performance indicators to understand the effectiveness of green infrastructure. Within sub-basins that have been “lagged as having significant redevelopment flood risks, additional strategies are proposed to reduce future flooding, including:

  • Elevating structures to meet base flood elevation standards --- placing occupied spaces and critical building components above anticipated flood levels significantly reduces flood risk.
  • Dry floodproofing for adaptation of existing structures --- making a structure watertight serves as a practical alternative to elevation.
  • Voluntary property acquisition and conversion for stormwater management --- appropriate for properties with recurring and severe flooding, where structural retrofits are neither feasible nor cost-effective.
  • Raising roads --- elevating roads helps to ensure that vital transportation networks remain functional.

Florida TaxWatch firmly believes that the recommended policies and strategies will, if adopted by formal action by the Board of County Commissioners and implemented, go a long way toward effectively mitigating the effects of sea level rise and increased land surface temperature. The Plan combines engineered solutions (e.g., seawalls, drainage system upgrades, etc.) with natural solutions (e.g., swales, green spaces, etc.) to protect critical infrastructure, manage stormwater, and reduce urban heat.

Economic and Financial Feasibility

The Plan, as written, appears to be economically feasible. The county deems a project to be economically feasible if the present value of its benefits is greater than the present value of its costs. The project study period for which the Plan evaluated economic feasibility is 2025 to 2125, which includes the construction and operation of Tier 1 and 2 investments over a 101-year period. Using the Vivid Adaptive Regional Input Output (V-ARIO) economic model to model the economy-wide impact of flood events, the Plan concludes that the Tier 1 and Tier 2 investments are determined to be economically feasible, as shown by their net present values, return on investment, and benefit-cost ratios.

The adoption of the near-term implementation strategy by the Board of County Commissioners has largely assuaged concerns about the Plan’s financial feasibility. The Plan identifies several funding sources available, as of 2024, to finance the implementation of the Plan; however, none of these can be considered dedicated funding sources. The Plan anticipates that “the county will work with the municipalities, the neighboring counties, and the state and federal governments as well as the private sector to identify sustainable and sufficient funding sources that would comprise the finance plan.”

The total price tag for implementing the Plan is estimated at $28 billion, with the bulk of that money ($19 billion) coming from private property improvements. The Plan envisions the private sector funds being used for increasing seawall heights, increasing water storage, and expanding swales. The Plan identifies a variety of ways to fund the $9 billion public share. Public funding sources identified in the Plan include a county surtax, county and municipal stormwater fees, grants, possible stormwater credit trading, annual fees, and public-private partnerships.

It is unclear how private property owners will come up with their $19 billion share of the costs. Private funding sources identified in the Plan include unspecified incentives (financial or other) and amended regulatory requirements for redevelopment. These include unspecified incentives for

property owners to convert impervious areas to pervious areas on private property; unspecified incentives and/or variances for new development or redevelopment in exchange for additional water storage and/or significant green infrastructure; unspecified incentives and other tools (i.e., a loan program) to property owners to make resilience improvements to their properties; unspecified incentives to encourage redevelopment in resilience overlay districts; and requiring property owners to provide on-site water retention or detention to a specified amount above existing requirements.

Although not physically a part of the March 2025 Plan, and in response to Florida TaxWatch’s initial comments on the Plan’s financial feasibility, the Broward Board of County Commissioners on June 9, 2026 approved a “near-term implementation strategy” designed to implement 263 identified Tier 1 stormwater conveyance projects over a 15-year period. Broward County will offer financial incentives in the form of grants to local governments for the construction of the recommended improvements. Broward County will establish a $20 million annual grant program, funds from which will be leveraged (5-to-1return on investment) to generate $100 million annually. Over 15 years, this translates to $1.5 billion in capital improvements funding. The 263 anticipated capital improvements projects and their associated costs are identified in Table 6. The maximum award amounts and estimated number of grants to be awarded are identified in Table 7.

The grants will be awarded as a result of an annual “call for proposals” each summer, with projects selected by the end of the calendar year and approved by the Board of County Commissioners the following Spring. The following criteria will be used to review and rank each project proposal:

  • Consistency with the County Resilience Plan;
  • Minimum 5-to-1 leveraging of the county’s cost share;
  • Project readiness;
  • Inclusion in a completed resilience plan, stormwater plan, or vulnerability assessment;
  • Demonstrated quantifiable flood risk reduction;
  • Demonstrated cost benefit;
  • Project location has been previously impacted by flooding; and
  • Project involves an interlocal partnership.

Staffing for the first year of program implementation will require a full-time Grant Administrator and a half-time Capital Program Administrator.

Roles and Responsibilities

It is unclear how Broward County will coordinate implementation of the Plan with surrounding counties and municipalities. The Plan states that “[F]lood control in South Florida is a shared responsibility between the South Florida Water Management District, counties, municipalities, local drainage districts, and homeowners’ associations.” The specific roles and responsibilities for each of these entities in implementing the Plan are not well-defined, so the answer to the question “who does what?” is unclear.

The Plan assigns responsibility for swale and stormwater management system maintenance activities to Broward County’s 31 municipalities. Responsibility for financing all of the investments, except for investments related to seawalls, water storage, and swales on private property is assigned to the “public sector.” Broward County’s specific roles and responsibilities are not well-defined.

The implementation strategy adopted by the Broward Board of County Commissioners on June 9, 2026 sheds some light on how the capital improvements identified in the Plan will be coordinated. This strategy includes establishing a $20 million annual grant program through which local government partners may submit proposals for funding for Tier 1 capital improvements projects. Broward County staff will administer the program and manage and track the estimated 263 capital improvements projects identified in Table 6.

Conclusions

The Plan as written is designed to provide the foundation for a basin-level, multi-decade resilient infrastructure and adaptation plan to make Broward County more resilient to the effects of sea level rise and increased surface level temperatures.  Florida TaxWatch understands the difficulty of planning 45 years into the future and commends Broward County for undertaking such an ambitious but necessary planning effort. The formal adoption of the near-term implementation strategy by the Board of County Commissioners in June 2026 helps to make the Plan more “actionable” and should give Broward County taxpayers greater comfort that the Plan will “work.”

[1] World Population Review, “Florida Cities by Population 2025,” retrieved from https://worldpopulationreview.com/us-cities/florida, July 14, 2025.

[2] Bureau of Economic and Business Research, “Projections of Florida Population by County, 2020–2045, with Estimates for 2018,” Volume 52, Bulletin 183, April 2019.

[3] Chronic inundation is defined as high tide flooding of 10 percent or more of usable, non-wetland area at least 26 times a year or, on average, every other week.

[4] Union of Concerned Scientists, “Underwater: Rising Seas, Chronic Floods, and the Implications for US Coastal Real Estate,” June 2018.

[5] North American Vertical Datum (NAVD) is a vertical control datum used in the United States and Canada for surveying and mapping. It serves as a reference for measuring elevations and is used in various applications, including floodplain management, construction, and engineering.

[6] See Florida TaxWatch, “Jacksonville’s Approach to Reducing Flooding and Stormwater Runoff Using Green Infrastructure,” September 2023.

[7] See Florida TaxWatch, “Using Microelectronic Sensors to Continuously Monitor Vertical Infrastructure,” April 4, 2025.

[8] Supra, see footnote 8.

[9] This is based on the consultant’s past experience and the fact that only about 23 -25 percent of the capital cost is for structures that require significant annual costs (e.g., pump stations, road crossings, storage areas, and control structures).

[10] Economic impacts are modeled using the Vivid Adaptive Regional Input Output (V-ARIO) model, which simulates the path of economic activity from a “shock” (i.e., flood) until the economy returns to equilibrium.

[11] This is the median coupon rate paid by counties and municipalities in Florida for bonds that finance water, wastewater, and stormwater projects.

Meet the Author:

Bob Nave
Bob Nave Senior VP of Research
LinkedIn

Become a Member

Support Responsible Taxation & Government Spending

Florida TaxWatch provides data-driven insights and policy analysis that help improve efficiency, accountability, and transparency across state and local government.

Scroll to Top